
Google Analytics goes way beyond simple analytical tools that are used for measuring a site’s performance. A number of enterprise-class tools are added to GA that makes it one of the most comprehensive analytical services available in the market.
The only way to take advantage of Google Analytics to its maximum potential is by learning to use the advanced tools offered on it.
Let’s take a look at some of these advanced features of Google Analytics:
What Can You Do With The Advance Segments?
Advanced Segments
The advance segments on Analytics allow you to divide your analytical data into different segments, helping you analyze the source of your website traffic more closely.
Below is a chart that provides advances segmentation based on the devices people are using to enter a website:
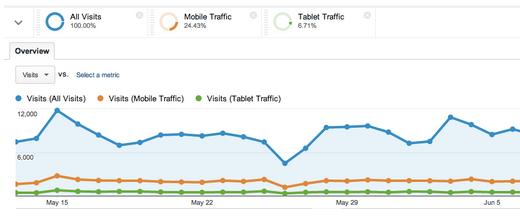
As you can tell, Mobile accounts for 24.43% of all traffic to this website. Now when analyzing this data, if the website isn’t mobile-friendly or isn’t responsive based website it is deeply hurting 24.43% of the traffic that is coming to the site.
This most likely means that mobile users are not going to come back.
Now with this data you can build a responsive based website with mobile/tablet users in mind. Providing a better user experience and you’ll probably find out that your bounce rate decreases and at the same time you will probably see an increase in traffic.
Another great example on the use of Segmentation is if you want to see how much traffic you receive from a particular social media platform, you can create a segment for it and view people coming to your site through Facebook or Twitter.
Other examples of segmentation can be:
• Continents
• Particular keywords
• Source domains
Custom Reports
If you need to create reports that are different from the usual reporting structure of Google Analytics, you can use the Custom Report tool. For these reports, you select the information and its related metrics you want to see, and you also decide how the information is organized for viewing.
To setup a Custom Report, follow Google Analytics step-by-step process here or for your convenience we’ve mentioned it below:
Step-By-Step Guide to Custom Reports:
1. On the Customization tab, click Overview in the left navigation.
2. Click + New Custom Report.
3. Enter a name for the report.
4. For Type, select Explorer (a hierarchy of data tables linked by clickable rows) or Flat table (a single table that shows all data).
a. Explorer
i. Enter a name for the first group of metrics.
ii. Click + add metric to add each metric. Click + add metric group to add a tab with another group of metrics.
iii. Click + add dimension to add dimensions.
Adding more than one dimension makes it possible for the person viewing the report to drill down into more specific data.
b. Flat Table
i. Click + add dimension to add a dimension. Add up to two dimensions
ii. Click +add metric to add a metric. Add up to 25 metrics.
5. Click Add a filter if you want to limit the report to a subset of data.
a. Select a dimension.
b. Select Include or Exclude.
c. Select the type of match you want: Exact or Regex.
d. Enter the value for your match.
6. If you want this report to be available in additional views, add them.
7. Click Save.
You can also create sub-reports within a single report by making multiple tabs. Once you create these custom reports, they will be saved in the system permanently and you can edit and use them any time you want.
We have listed off a couple really great custom report ideas you should be using:
· Keyword Analysis Reporting
· Conversion Reporting
· Brand awareness Report
· Traffic Source Reporting with Goals
· Pay-Per-Click Analysis
· E-Commerce Traffic/Goal Reporting
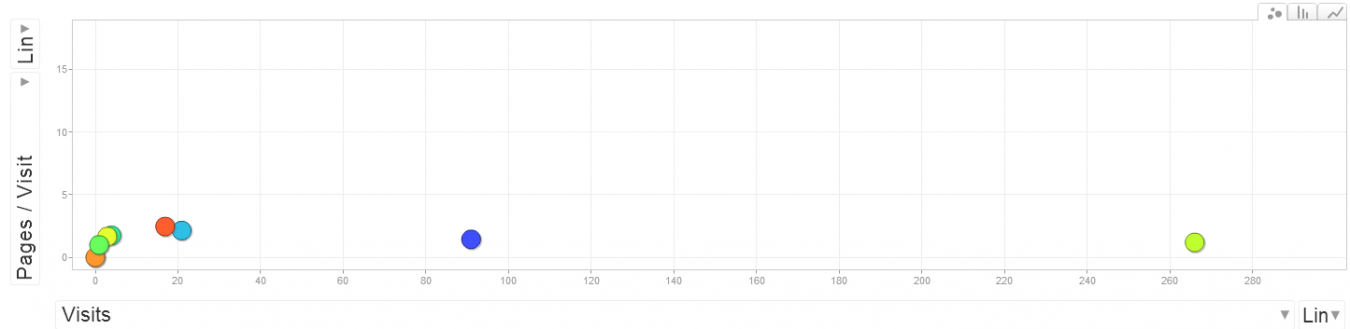
Motion Charts
If you want higher-quality charts for your analysis, these motion charts provided by Google Analytics are just what you need. These charts are multi-dimensional, featuring different bubbles for different metrics. These bubbles show how reports integrate with each other using the multi-dimensional structure to show the relationship.
Visual representation of reports can help you in understanding the analysis in a much better way.
An example of a motion chart in action is below: