


Google Analytics is a fantastic tool for tracking your website’s traffic and activity. But did you know that you can also create custom reports to track precisely the data that’s important to you? This blog post will show you how to create custom reports on Google Analytics 4 (GA4). By using custom reports, you’ll be able to dig deep into your website’s data and get actionable insights that will help improve your marketing efforts. So dive in and start creating custom reports today!
Why Are Reports Important?
One of the most important aspects of web analytics is tracking your reports. By monitoring your reports, you can ensure that you are getting the most accurate data possible. This, in turn, allows you to make better decisions about your website and how to improve it.
When it comes to tracking data, pulling reports is essential. Google Analytics 4 (GA4) offers a variety of default reports that give you insights into your website traffic and activity. However, you also have the option to create custom reports.
Creating custom reports in GA4 lets you specify exactly what data you want to track. This is incredibly useful if you’re going to focus on specific metrics or dimensions that are important to your business. It also allows you to create reports specific to your needs, which can be incredibly helpful if you want to track data that isn’t covered in the default reports.
This blog shows you how to create a custom report and how to create a basic report!
How to Create A Custom Report
1. Log into your Google analytics 4 (ga4) account
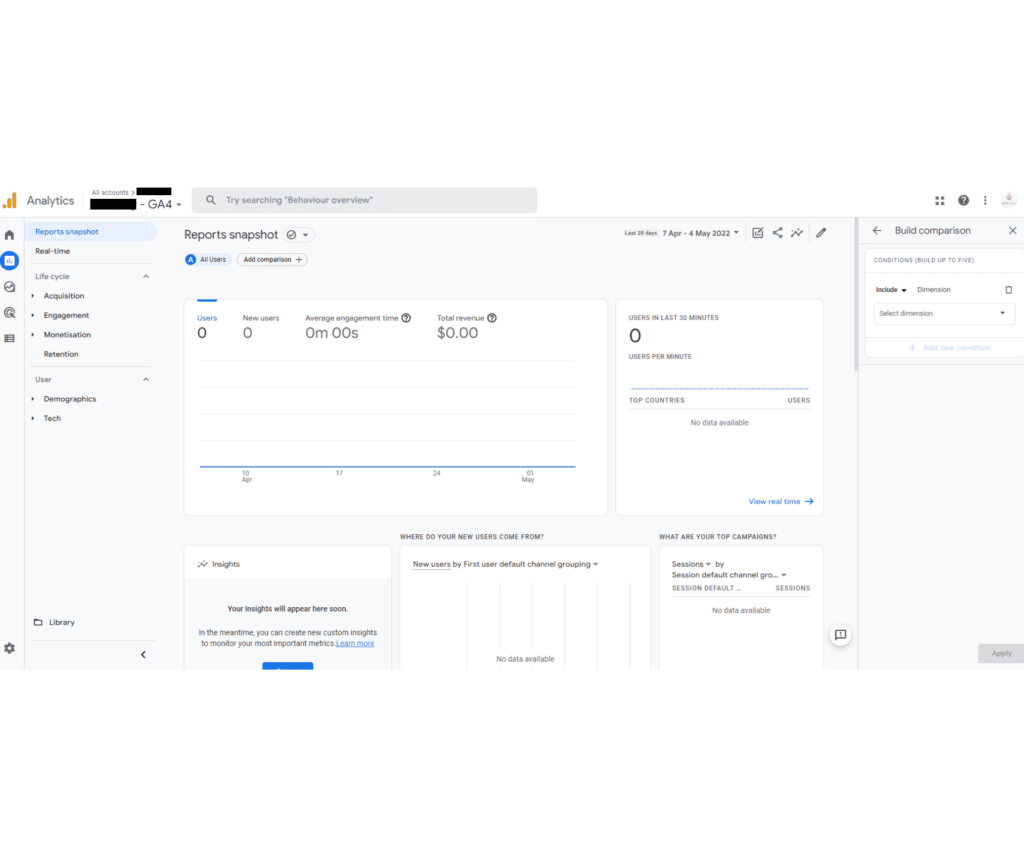
2. Start on the first Reports snapshot

3. On the left-hand side, click reports ![]()
4. Click customize report on the right side of the page. You’ll then be sent to your customized report that allows only 16 cards.
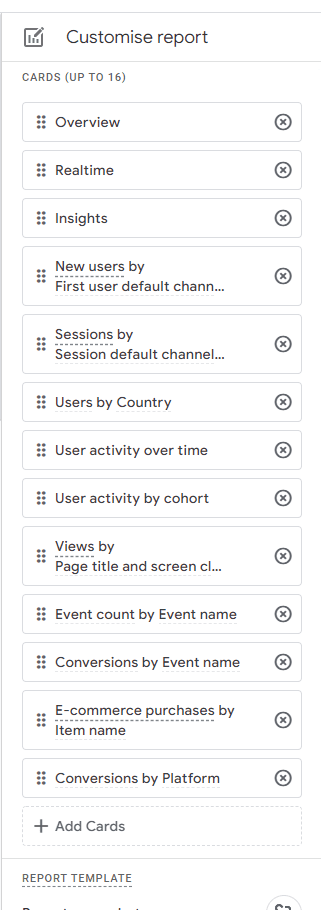
5. Customize the report based on your end goal/conversion
6. Scroll through the right side of the page and click Add Cards
7. You are then given an option to add cards.
Two options are shown:
- Summary Cards
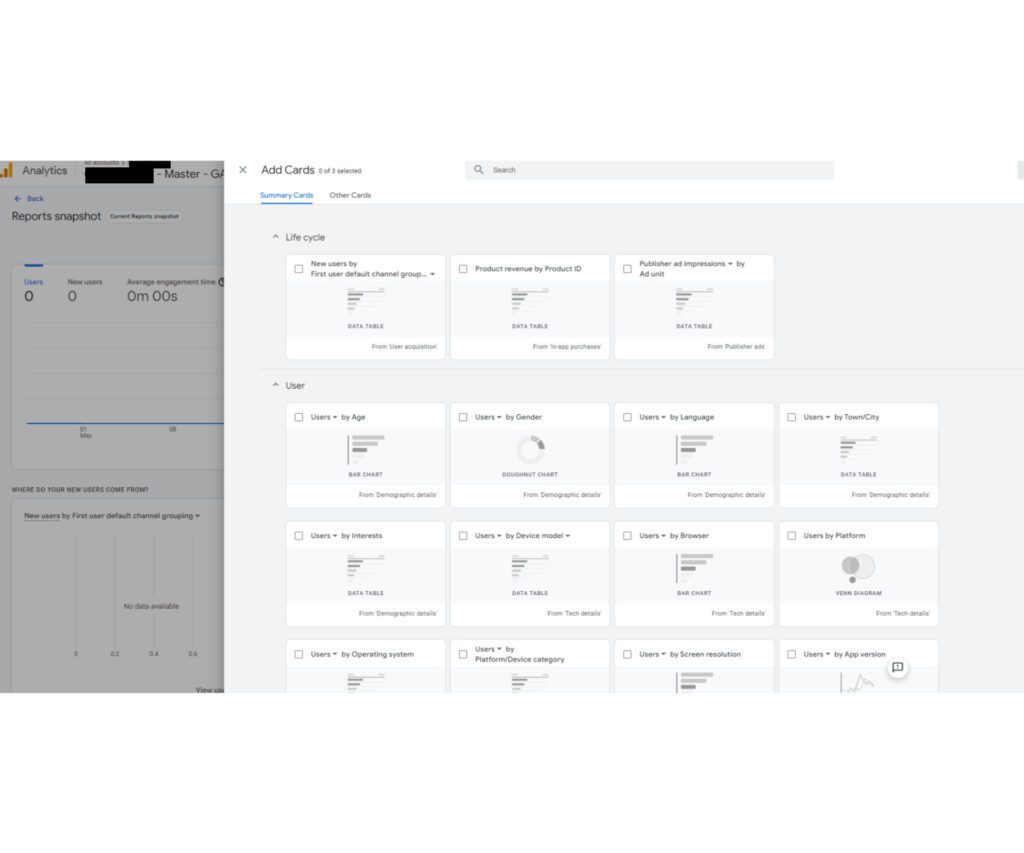
- Other Cards
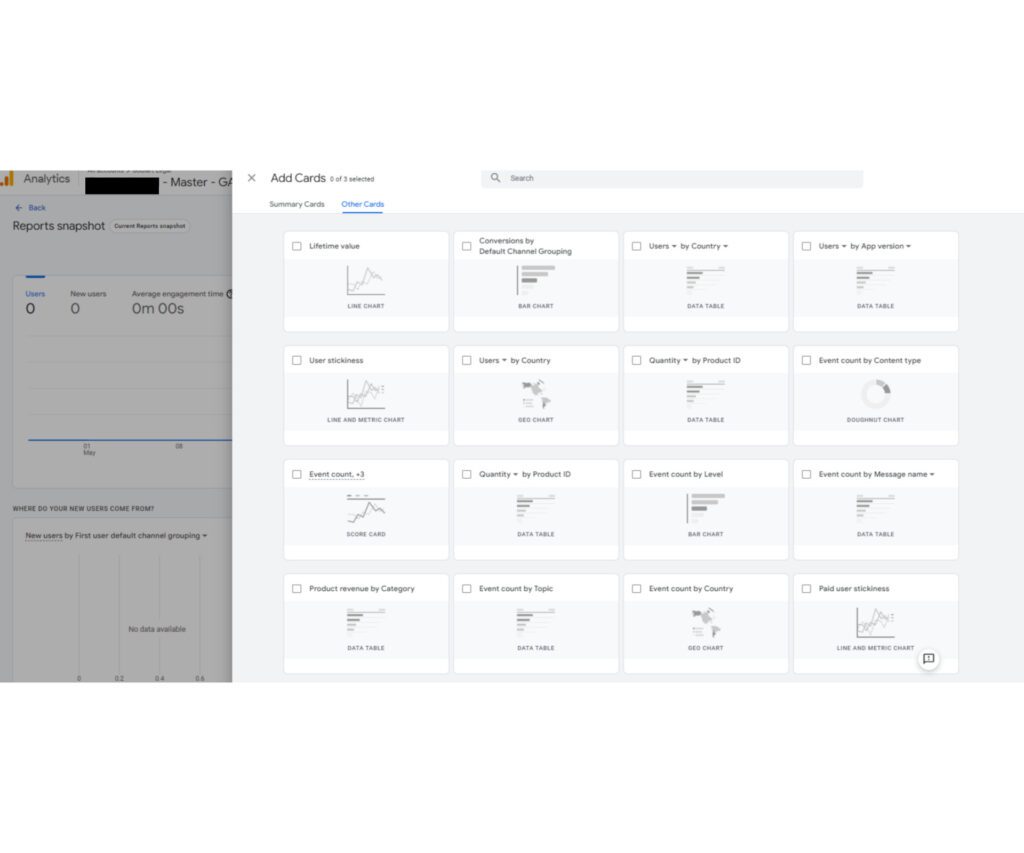
However, be aware Google Analytics 4 only allows you to choose an additional 5 cards.
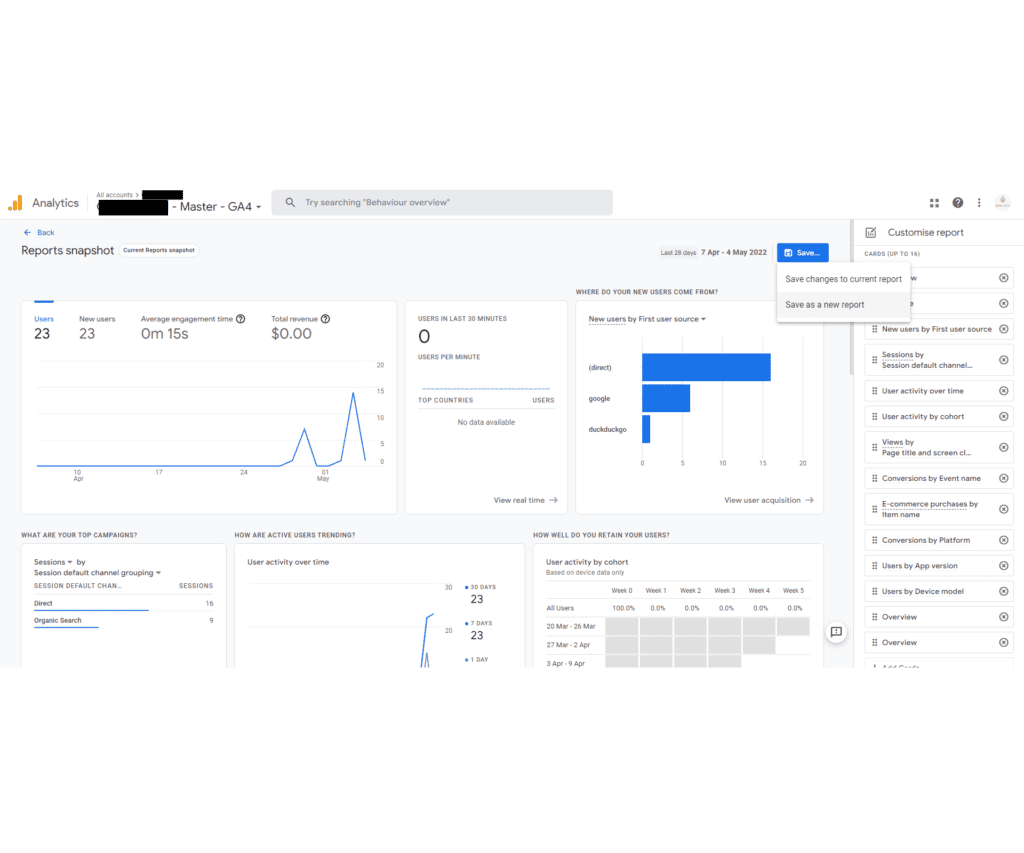
8. Once you choose all the cards you’d like in your report, click save; two options will show in the drop-down. For best practice, click “rewrite a new report.”
How to Pull A Basic Report
1. Log into your Google Analytics 4 (GA4) account
2. Click reports
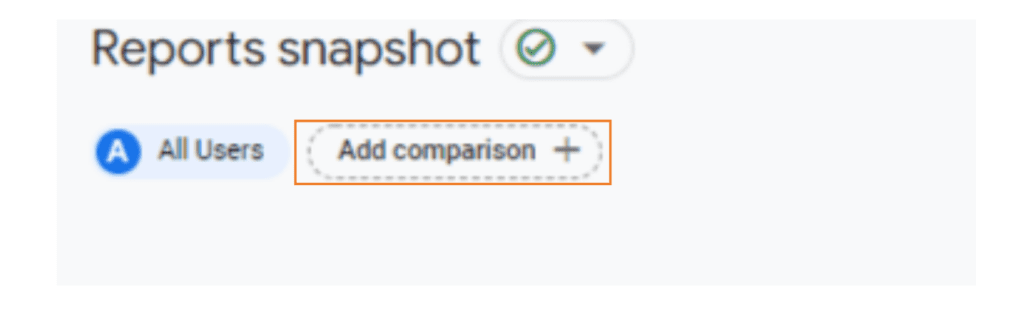
3. Ensure All Users are selected

4. Click Add comparison, Click the drop-down arrow > Select Dimension
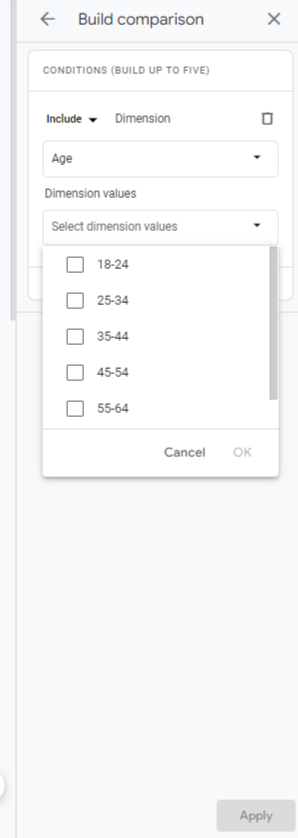
5. Click Age, select your desired age group and desired gender; when you’re done, click Apply
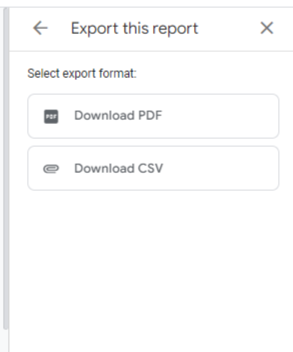
6. Click the share this report icon

7. Click download this file > Download Report
Congratulations, you downloaded your Google Analytics 4 Report Snapshot!
Want to get started on Google Analytics 4? Sign up for our newsletter, and we’ll send you more blogs about GA4 on how to get started. In the meantime, experiment with some of the principles we talked about in this post and see how they work for your business. Thanks for reading!